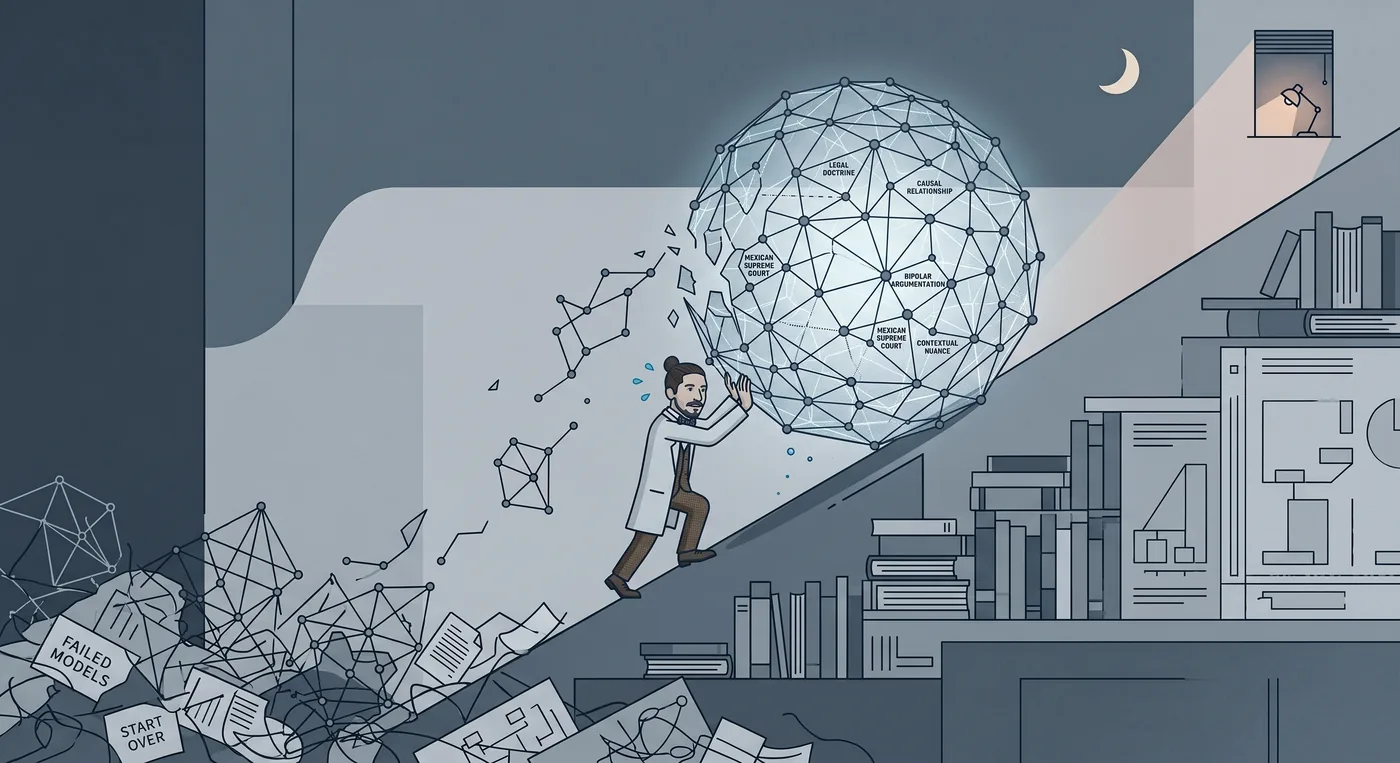
11:35 p.m. It’s not too late to think, yet. As I work on my doctoral thesis, I’m tinkering with a small tool to model legal reasoning. It’s an annotation tool, and this tool will lead me, with a certain fascination, to grapple with an existential question (at the very least, existential as it pertains to this thesis). This question goes beyond the scope of my research.
My work relies heavily on what’s called causal artificial intelligence. To put it simply, with most traditional AI tools, we’re content to run statistics. We model the fact that two things often happen together (for example, ice cream sales and sunburns both increase at the same time in the summer). But we don’t say that one causes the other, at least not if we want to be precise. With causal AI, the goal is to go further: we seek to establish cause-and-effect relationships. In short: we try to draw arrows instead of merely noting coincidences.
To do this, we use causal discovery algorithms.
Causal Discovery on Legal Data
The principle is as follows: we process large data tables. In my case, my rows consist of thousands of court decisions, and my columns consist of legal concepts, which may be flagged as appearing in the text and, if so, exactly where.
We mathematically derive a sort of map from this. The concepts are points (nodes), and a line connects those that depend on one another (edges). In other words, using advanced methods, we seek to calculate in a matter of seconds correlations that would take a human months to untangle by hand.
But we run into a limitation. With these algorithms, we can generally identify that there is a link between two concepts. However, we struggle to extract the meaning from it. “A goes with B” and “B goes with A,” viewed through a simple presence matrix, are as alike as two peas in a pod. The meaning of the arrows remains invisible through this statistical lens alone.
To get around this conundrum, I asked myself a question: what if the order in which concepts appear in a text allowed us to deduce that elusive meaning? What is written first would lead to what comes next. When you think about it, that’s not such a bad idea, because that’s how reasoning unfolds. Unless… maybe not.
So I developed a small interface that displays an actual ruling from the Mexican Supreme Court, with the concepts highlighted. Within it, as a legal professional, I manually draw the connections I actually identify while reading, along with their meanings. The idea is then to compare: does my hypothesis (that the order of narration establishes the causal relationship) match the arrows drawn by an expert?
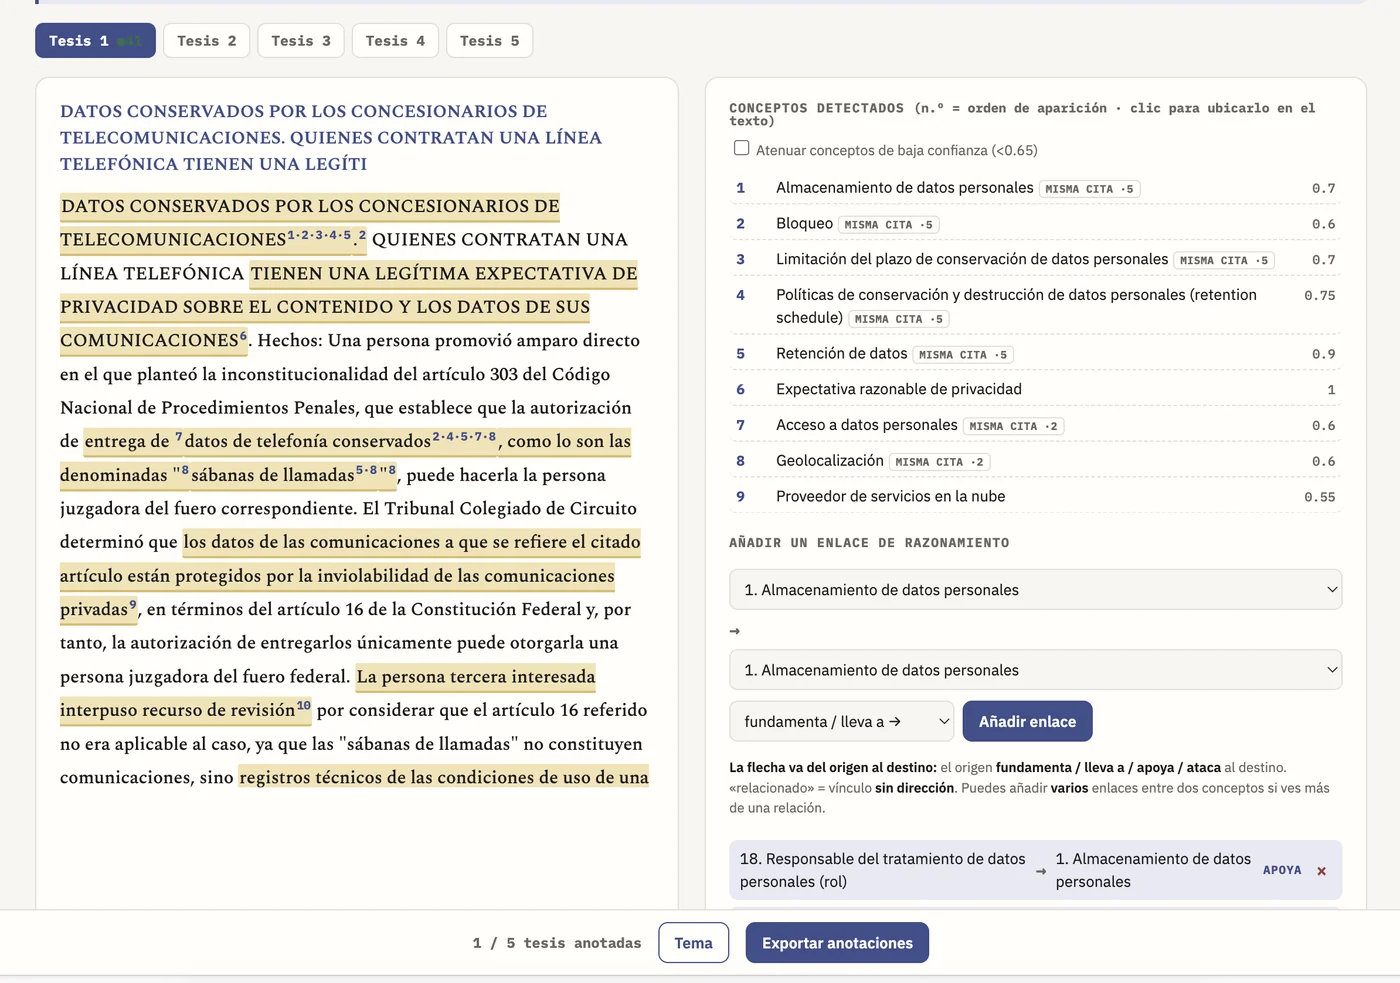
And that’s where, while drawing on this actual ruling, I hit a snag.
A judge’s reasoning doesn’t fit neatly into boxes
To make the text fit into a reasoning diagram, I have to pare down the syntax and eliminate nuances. And I realize that what I’m cutting out is often valuable, even indispensable. Worse still: I find myself having to draw a connection and its opposite.
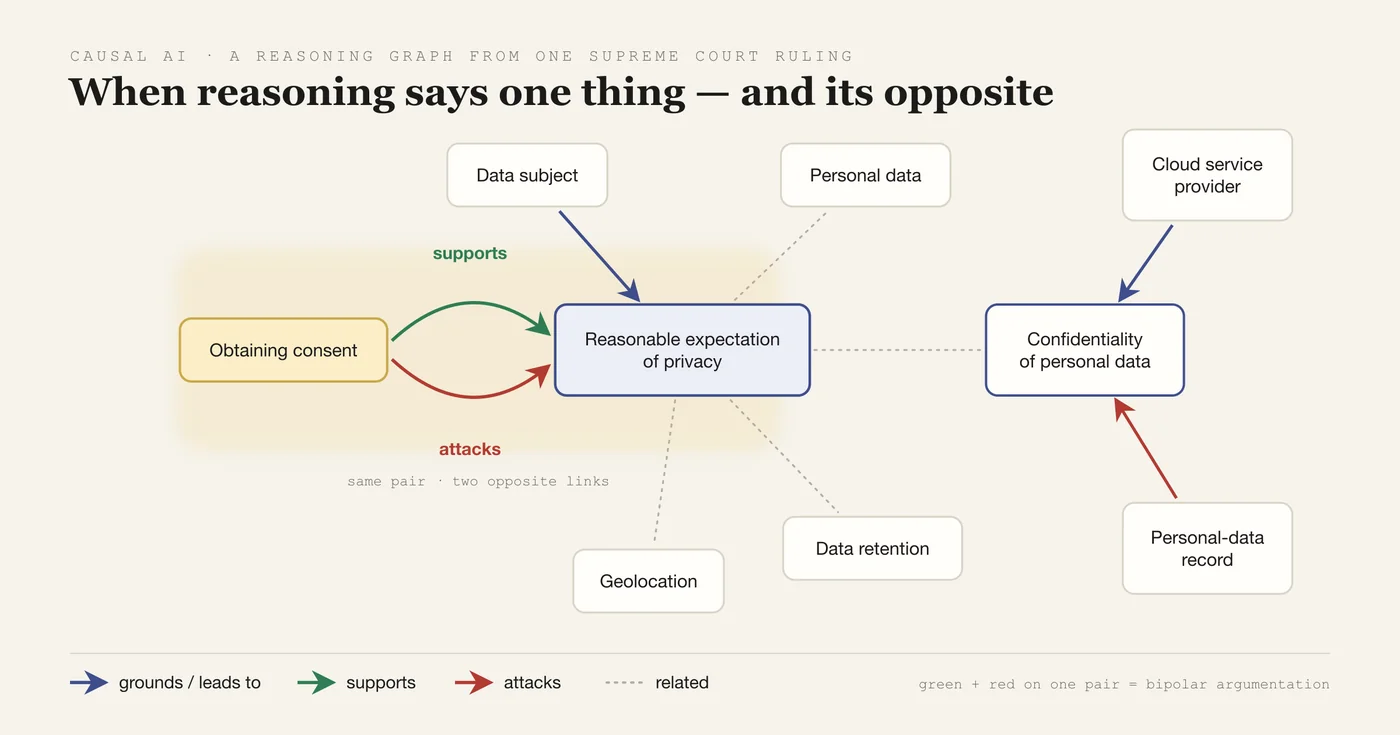
It sounds absurd in mathematical logic, but it’s perfectly commonplace in law. A judge often states a legal doctrine only to better dismantle it. In the ruling I was modeling, the analysis begins by restating an old idea: “By entrusting your data to a service provider, you give up your privacy.” Then it is reversed: but in the present context, no, you retain a legitimate expectation of privacy. On my diagram, this looks like the following: concept A supports concept B… then, a few lines later, the same concept A attacks concept B!
This is what’s called bipolar argumentation. In a debate, an argument can do two things: support an idea, or reject (attack) it. Two poles that coexist. Saying one thing and its opposite is a contradiction in classical logic, but in a text, it’s simply… the art of reasoning. However, modeling these two poles on the same pair of concepts, at two different moments, is exactly what causes a simple graph to break down.
This led me to a rather paradoxical thought. Of course, I could design a chronological and argumentative graph rich enough to capture everything: the order, the supports, the attacks, the reversals. Except that… that graph would be at least as complex as the text itself. My modeling tool, which is supposed to simplify things, would become just as dense as what it represents. Not that it would contain more words, but one would have to learn to decipher its visual grammar, whereas we already know how to interpret a text.
And that’s when a question occurred to me. If the map of a text is as rich, and as complex to interpret as the text itself… then isn’t a written text, with its words, commas, and flow, already, in and of itself, the best of all graphs? Perhaps human language is the most compact graph ever invented, and I’m struggling, somewhat naively, to redraw it with dots and arrows. It’s not working. I start over. Sisyphus isn’t far off…